
Finally, after weeks of talks, article, blog and whatever, we are near to the hard fork.
In my opinion, we are on the edge, ready to make a jump, even if we don't know if we'll reach the rock on the other part without falling in the deep.

Let's see the charts!
BITCOIN
MEDIUM TERM
In my opinion, we are on the edge, ready to make a jump, even if we don't know if we'll reach the rock on the other part without falling in the deep.

Let's see the charts!
BITCOIN
MEDIUM TERM
Daily chart
Very tricky situation: Bitcoin is in the upper part of ascending channel and there is an evident risk of reversal. These are the key points:
- situation very similar to the one of August: look at the red numbers
- RSI in overbought area
- MACD has just given a sell signal
In my opinion we have two possible scenario:
1. Bitcoin price fall on support at 4967$
2. Bitcoin continues in a sideways trend

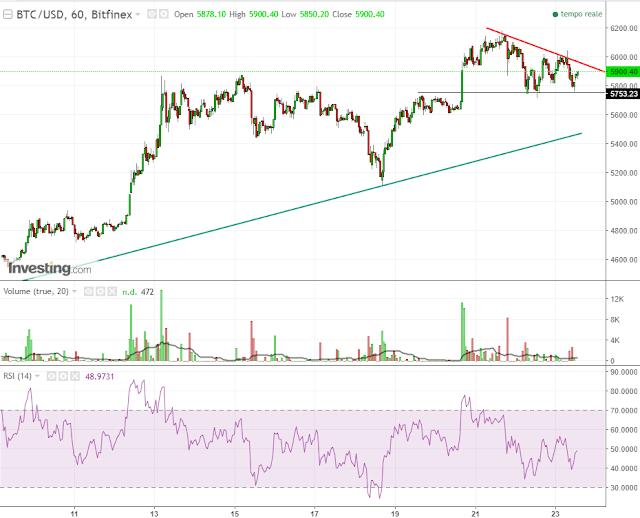
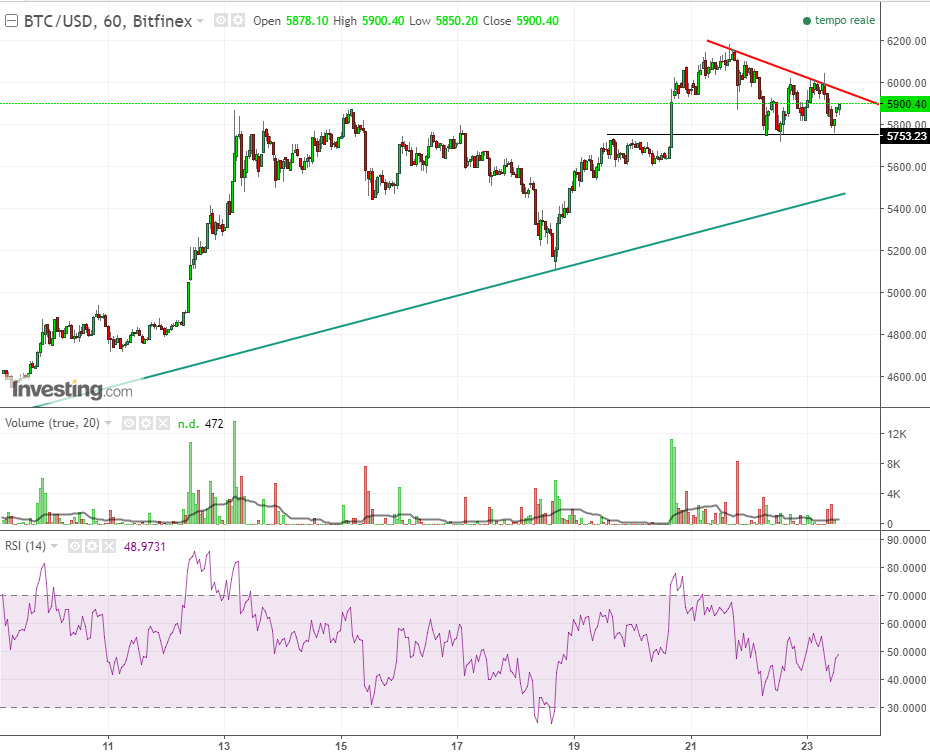
SHORT TERM
1 hour chart
We are in a triangle, with a support at 5750$ and dynamic resistance on descending red line. We must wait for a break of one of those lines to decide our strategy.
Honestly, I'm not very positive...
We are in a triangle, with a support at 5750$ and dynamic resistance on descending red line. We must wait for a break of one of those lines to decide our strategy.
Honestly, I'm not very positive...
____________________________________________
If you like this post, fell free of sharing it on social networks. You can also keep updated on CryptoCharting analysis, just pressing "SUBSCRIBE" button on the top of this page.
Comments are welcome!
Comments
Post a Comment