Some days before the creation of Bitcoin Gold, I wrote an article (you can read it here) where, in the last part, I made my considerations on this new coin and the implications for Bitcoin.
I don't mean to brag, but now I can say that I was right. Speculation based on nothing brings only problems and that's why I think that this kind of operations weaken Bitcoin image.
It's something that does not exist: it's a mirage
But now alea iacta est, so let's see the charts.
I don't mean to brag, but now I can say that I was right. Speculation based on nothing brings only problems and that's why I think that this kind of operations weaken Bitcoin image.
It's something that does not exist: it's a mirage
But now alea iacta est, so let's see the charts.
BITCOIN
MEDIUM TERM
MEDIUM TERM
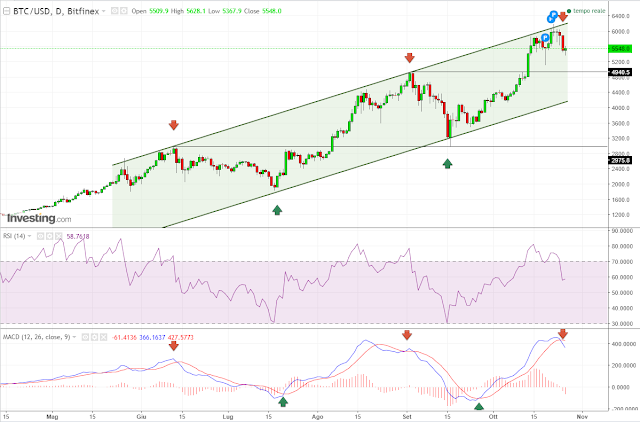
Daily chart
As I wrote in this article some days ago, the situation wasn't positive for Bitcoin, not for its long term trend, that remains stable (green channel), but mainly because we had 3 signals of a possible retracement:
- RSI overbought
- MACD in sell mode
- Upper part of the channel acting as resistance
Now the retracement has begun and I think that 4967$ is a possible target.
SHORT TERM
1 hour chart
The scenario described for long term is confirmed also by short term chart. Ascending trendline has been broken, there was a pullback and now it's possible to see a movement until 5200$.
Only the breakout of the red channel could give a reversal signal.
Today I post also the chart of Ethereum, very interesting for the long term view.
As you can see, we have a first BUY signal given by ascending trendline (green line), but MACD is not so convincing yet.
It's possible to enter at current price, but I suggest a stop loss for the breakout of that line.
First target: 341$.
The scenario described for long term is confirmed also by short term chart. Ascending trendline has been broken, there was a pullback and now it's possible to see a movement until 5200$.
Only the breakout of the red channel could give a reversal signal.
ETHEREUM
MEDIUM TERM
MEDIUM TERM
Daily chart
Today I post also the chart of Ethereum, very interesting for the long term view.
As you can see, we have a first BUY signal given by ascending trendline (green line), but MACD is not so convincing yet.
It's possible to enter at current price, but I suggest a stop loss for the breakout of that line.
First target: 341$.
____________________________________________
If you like this post, fell free of sharing it on social networks. You can also keep updated on CryptoCharting analysis, just pressing "SUBSCRIBE" button on the top of this page.
Comments are welcome!


Thank you for sharing this information.
ReplyDeleteCoinOrbisCap is the best user-friendly financial app who take digital currency seriously. Gives you quick access to crypto prices, market cap, coin chart, crypto news on over 1500 currencies.
Download here for FREE!!
Thank you for sharing this information.
ReplyDeleteCoinOrbisCap is the best user-friendly financial app who take digital currency seriously. Gives you quick access to crypto prices, market cap, coin chart, crypto news on over 1500 currencies.
Download here for FREE!!