
During the last part of Asian session cryptocurrencies had a sharp intraday drawdown.
Let's see if this fall has compromised the technical situation we drew yesterday.
BITCOIN
MEDIUM TERM
Daily chart
Medium term analysis is unchanged: trend is still positive and both MACD and RSI did not give any worrying signal.
Resistences:
- 4670$
- 4900$
Supports:
- 4147$
- 3571$

SHORT TERM
1 hour chart
Yesterday I wrote that RSI was in overbought area and needed to go down. That just happened and RSI is now in oversold area, showing a good probability of a short term rebound.
Looking at price levels we have a bad news and a good one.
Bitcoin has just broken the ascendent trendline, and this is a negative point, considering that it has accompanied price since September 25.
However the support at 4230$ wasn't broken and this is a good news, because a breakout would change technical situation.
So, what to expect?
I expect a sideways trend between 4250$ and 4370$: a breakout of one of these two levels would be a buy (or sell signal)

ETHEREUM
MEDIUM TERM
Daily chart
No change on medium term analysis. Trend is positive, MACD has given a buy signal, while RSI is in neutral area.
Honestly I can't see clear signals, so I would wait for future indications.

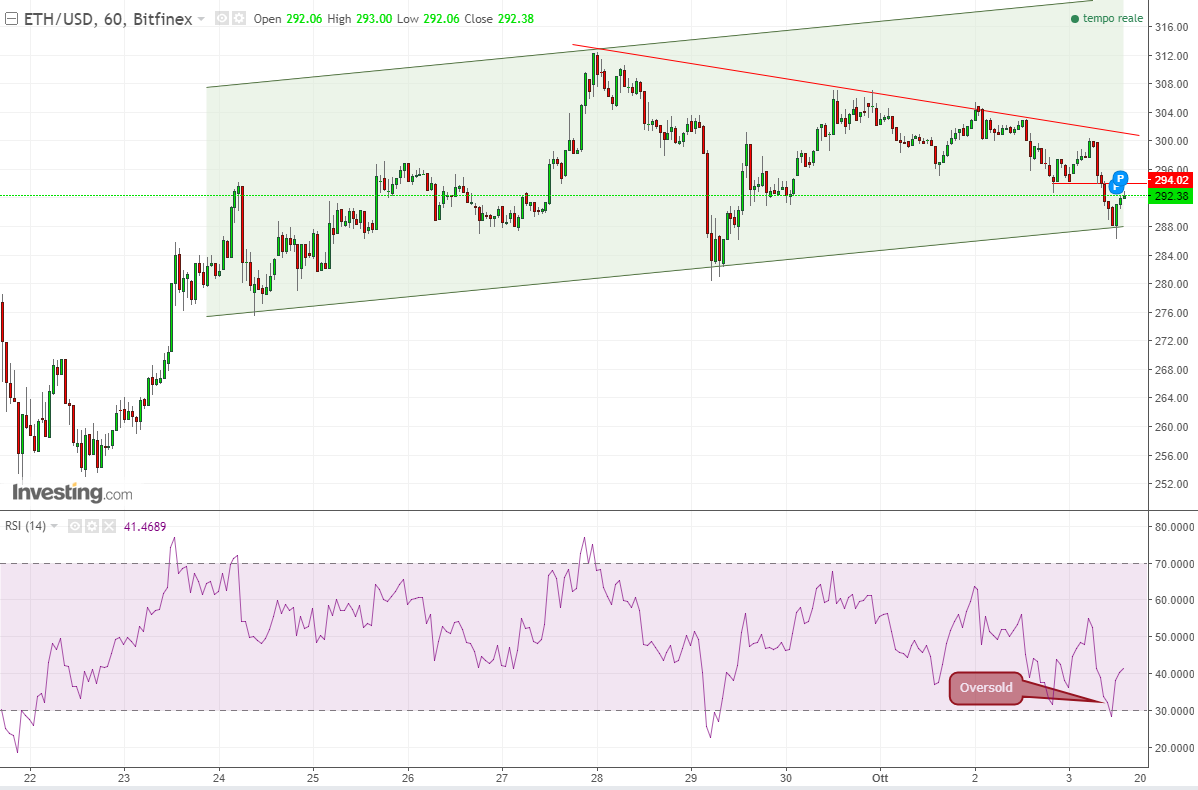
SHORT TERM
1 hour chart
Price has just touched dynamic support in the ascendent channel and RSI was in oversold area.
The situation is similar to Bitcoin: it could be a good signal for a short term trade, in order to take advantage of a rebound.
First resistence is at 294$ and the second one at 300$.

If you want to keep updated on CryptoCharting analysis, just press "SUBSCRIBE" on the top of this page.
Comments are welcome!
MEDIUM TERM
Daily chart
No change on medium term analysis. Trend is positive, MACD has given a buy signal, while RSI is in neutral area.
Honestly I can't see clear signals, so I would wait for future indications.

SHORT TERM
1 hour chart
Price has just touched dynamic support in the ascendent channel and RSI was in oversold area.
The situation is similar to Bitcoin: it could be a good signal for a short term trade, in order to take advantage of a rebound.
First resistence is at 294$ and the second one at 300$.
If you want to keep updated on CryptoCharting analysis, just press "SUBSCRIBE" on the top of this page.
Comments are welcome!
Comments
Post a Comment