
Bitcoin Gold and Byzanthium: every investor is waiting to see the effects of these two events on Bitcoin and Ethereum rispectively.
In this context, we must consider not only the technological developement, that could be important in the long run, but also current positioning of investors. Don't forget that in the last weeks we saw a switch from altcoins to Bitcoin, in order to obtain free money (unreal) from bitcoin gold.
What will they do after hard fork?
On Ethereum the situation is different, because there isn't any gift with Byzanthium, but only a technological upgrade. It's not a speculative news, and in fact we haven't seen an income flow, so the price is not moving much in last hours, following tiredly Bitcoin price. This situation could be negative in short term, but positive in few weeks, because there isn't a risk of speculative take profit.

Let' see the chart!
BITCOIN
MEDIUM TERM
Daily chart
As we undelined on our last analysis, Bitcoin has completed its breakout, reaching the upper part of ascending channel.
RSI was in overbought, so a retracement was expected. It does not mean that the price will go automatically to 4900$, but it's a possibility to keep in consideration.
First support is at 5400$ and the other one is at 4943$.

SHORT TERM
1 hour chart
The consolidation we were talking about could be seen in short term chart, in sideways channel included between 5400$ and 5800$.
The movement could continue, so we must wait for a breakout of one of these two levels.

The growth is more gradual on Ethereum, but it could be more healthy considering the absence of speculative inflows.
Trend is positive and indicators are far from overbought area: this calm situation could move up a spike (target 388$), but at the moment we haven't clear signals.

Previous resistance at 314$ is now an important support.
Price is now moving into a sideways channel between 320$ and 350$. We have to wait for a breakout: situation very similar to Bitcoin.

The consolidation we were talking about could be seen in short term chart, in sideways channel included between 5400$ and 5800$.
The movement could continue, so we must wait for a breakout of one of these two levels.

ETHEREUM
MEDIUM TERM
Daily chart
The growth is more gradual on Ethereum, but it could be more healthy considering the absence of speculative inflows.
Trend is positive and indicators are far from overbought area: this calm situation could move up a spike (target 388$), but at the moment we haven't clear signals.

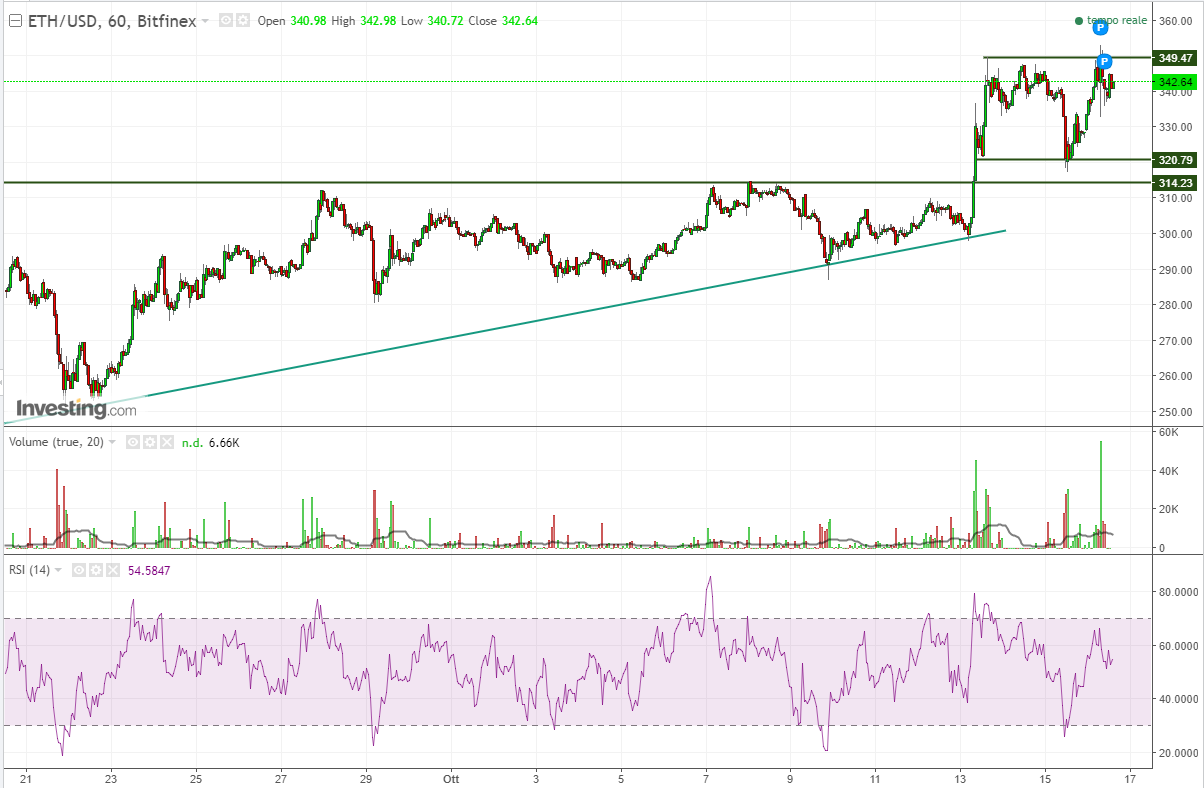
SHORT TERM
1 hour chart
Previous resistance at 314$ is now an important support.
Price is now moving into a sideways channel between 320$ and 350$. We have to wait for a breakout: situation very similar to Bitcoin.
RIPPLE
SHORT TERM
1 hour chart
Very interesting situation on Ripple chart. As we showed here, in the last weeks it was the only cryptocurrency uncorrelated to Bitcoin.
Trend is positive and we are in the upper part of a sideways channel: a breakout is possible with target 0.3$.
MACD has given a buy signal, while RSI is just entering in overbought area, but it has room to push price again.

____________________________________________
If you like this post, fell free of sharing it on social networks. You can also keep updated on CryptoCharting analysis, just pressing "SUBSCRIBE" button on the top of this page.
Comments are welcome!
Comments
Post a Comment